A Statistical Analysis of The Challenger Accident
On the morning of January 28th, 1986 at Cape Canaveral, NASA’s space shuttle, Challenger, was scheduled to take off. Many watched the broadcasted event optimistically, while concerns were growing among the Thiokol (manufacturer) engineers of the spacecraft because of the significantly low temperatures before take-off, which may cause an issue with the shuttle containing its hot gases.
NASA ignored these warnings and decided to continue the scheduled launch. Unfortunately, the engineers’ suspicions turned out to be correct; 73 seconds into the flight, the shuttle was completely blown apart, leading to the death of all seven astronauts.
What should have been a historic moment turned out to be one of the worst space shuttle disasters ever observed. Investigations were done exploring the causes of the ship’s fuel tank explosion, which ultimately traced back to the O-rings that prevented hot gas leakage.
There have been many accusations and arguments made about who’s at fault, but a thorough understanding of the disaster requires a statistical analysis of the available O-ring data containing information about temperature and success/failure rates.
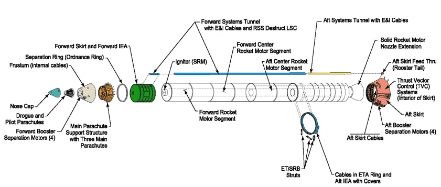
Analyzing the failures of the O-rings requires an understanding of the underlying structure of Challenger. The shuttle’s rocket boosters were made up of four segments filled with fuel and oxidizer and were assembled and sealed with O-ring seals, a critical component that prevented hot gas leakage during launch.
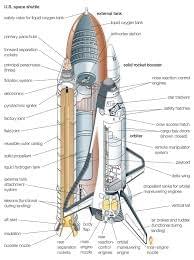
However, the responsiveness of the seals had never been tested in cold temperatures.
On launch day, the temperature was 31 degrees Fahrenheit, significantly lower than the temperatures that the O-rings were tested in. After takeoff, one of the O-rings broke, causing hot gas to heat the liquid oxygen and hydrogen inside the tanks, ultimately rupturing the boosters and tearing the shuttle apart1. So why was the decision made to continue the launch, despite the warnings by the engineers?
Before the launch of Challenger, nobody had analyzed the association between temperature and the responsiveness of the O-rings. NASA decided to take a risk by launching the shuttle, not knowing the true statistical likelihood of O-ring failures at 31 degrees.
The engineers’ concerns were based on suspicions and incomplete analysis. The engineers only looked at low temperature O-ring data which included 4 failures. By ignoring data about flights at higher temperatures, the calculated probability of failure was lower than what it should have been2. This analysis is not only incorrect but also dangerous and led to the disaster.
Data from all flights that were recorded should be taken into account. There have been many O-ring failures at both high and low temperatures, but the strength of the association between these two variables had not been measured. The engineers cannot simply ignore the flights with higher temperatures.
An in-depth statistical analysis of the efficiency of O-rings at various temperatures is required to truly understand the failure of Challenger. Intuitions and biased analyses, especially by NASA management, are not sufficient to determine the probability of the O-rings failing.
A sample of the O-ring failures data is shown below:
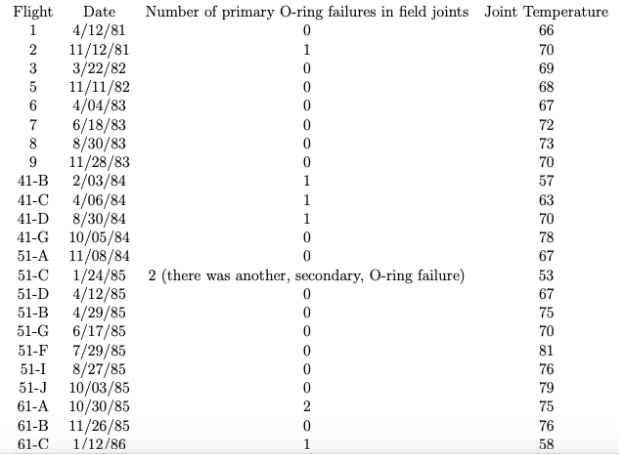
Sample O-Ring Data3
A permutation test can be run to evaluate the statistical significance of the difference between O-ring failure rate at low temperatures and failure rate at high temperatures. This can determine whether lower temperature O-rings tend to experience more failures than high temperature O-rings, or if the failure distribution is the same among the two. The hypotheses of this statistical test are as follows:
The true mean difference between O-ring failure rate at low temperature and high temperature is 0. Observed differences are due to random chance.
The true mean difference between O-ring failure rate at low temperature and high temperature is greater than 0. Observed differences are not due to random chance, but an association between temperature and failure rate.
The permutation is run by grouping each data point in two groups: high and low temperature. Looking at the temperature distribution, O-ring observations can be split into below 65 degrees (low temperature) and above 65 degrees (high temperature).
The observed mean difference of failures between low and high temperatures O-rings is 1.3; the temperature column is permutated (shuffled) and the simulated mean failure difference is calculated again among the two groups of O-rings. Running 10,000 simulations of this permutation test yields 10,000 simulated test statistics. From this, we can calculate the p-value to evaluate the null hypothesis:
Only 1.2% of the simulated mean failure differences are greater than the observed mean failure difference. A p-value of 0.012 is statistically significant to reject the null hypothesis stating that failure rates for O-rings in low and high temperatures come from the same distribution.
The observed difference is far greater than the differences in the shuffled O-ring data. This suggests that the failure rate between low temperature and high temperature O-rings is not from the same distribution. The data shows evidence supporting the alternative hypothesis stating that low temperature O-rings have a greater mean failure rate than high temperature O-rings.
There definitely appears to be a difference between O-rings tested in low temperatures and O-rings tested in high temperatures, but it is useful to examine the underlying model of the data.
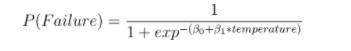
It is important to estimate the probability of O-ring failure at a given temperature. This can be done by fitting a logistic regression model on the above data, with temperature as input and a binary value (1: at least one failure, 0: no failures) as the output. A logistic regression can be fitted with the following parameters:
When:
is the coefficient of temperature measuring the association and
is the bias.
Furthermore, the strength of the association can be tested by computing a z-value in regards to the following hypotheses:
The true coefficient of temperature for the model is 0, indicating no relationship between temperature and O-ring failure.
The true coefficient of temperature for the model is not 0, indicating some relationship between temperature and O-ring failure.
Fitting the data to a logistic regression outputs a model with the following weights:
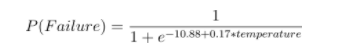
A plot is shown below to visualize the failure distribution and fit of the model:
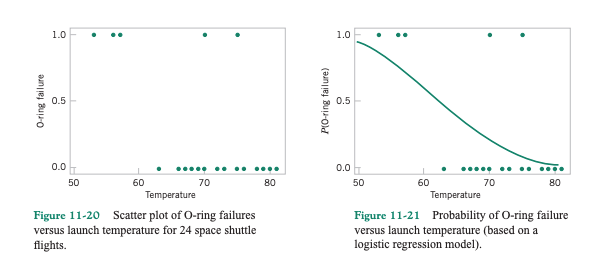
Logistic Regression Plot of O-Ring Data4
As observed in the plot, a temperature of 31 degrees appears incredibly likely to have at least one failure. The model outputs a value of 0.996, indicating a 99.6% chance of failure given the observed data of past shuttle launches.
This is far from a close call and is certainly not odds to gamble with when there are seven crew mates on board.
Furthermore, the strength of the association between these two variables can be analyzed with the z-statistic generated on the temperature coefficient model weight. The calculated p-value of the null hypothesis:
turns out to be 0.04, which is statistically significant when using a threshold of 0.05. Because of the low p-value, we reject the null hypothesis stating that the coefficient of temperature is 0. There is strong evidence in the data that supports the alternative hypothesis:
suggesting that the coefficient is greater than 0 and that there is indeed an association between temperature and O-ring failure. Therefore, it can be seen that there is strong evidence that low temperatures can lead to O-ring failure. The engineers should have presented a logistic regression analysis as evidence to delay the Challenger launch.
There are many possible explanations as to why NASA officials decided to ignore all the warnings by Thiokol engineers and proceed with the launch. Some say it was due to the simple fact that NASA wanted to prove others wrong and uphold its highly ambitious launch schedule.
Others argue that it was due to bureaucratic reasons and that NASA was pressured to have the launch so it could be mentioned in Ronald Reagen’s state of the union address occurring on the same day. No matter the reason, NASA should not have taken such a large gamble and should’ve delayed the launch to another day.
The analysis of the data clearly portrays the risks, but nobody had done a thorough investigation beforehand. As a result of the disaster, the space shuttle program was shut down for years until all internal problems were addressed by NASA.
Extensive research was done in analyzing all of NASA’s failures and significant changes were made to address existing incompetencies. Research reports were published that describe the inability of the O-ring to keep its elasticity after exposure to cold temperatures.
A presidential commission was formed to investigate internal issues in NASA and oversee the restructuring of mission planning and management. NASA remodeled a significant portion of the current shuttle design to reduce risks of failure points.
Management training was also heavily enforced, shifting the dynamics of work culture. Officials and engineers were all responsible for addressing every concern that arose through the launch process5. It took two years for NASA to repair damages, restructure, and reopen.
This disaster became the foundation for NASA to improve its decision-making and management-engineer coordination. After changing internal operations and setting new ethical and production standards, NASA continued its space shuttle program with better-managed missions. Discovery was the first mission after reopening and went smoothly. This became the advent of a series of successful missions learning from the mistakes made in Challenger.
The Challenger disaster shows why scientists and engineers need an understanding of statistical techniques. The basic analyses described provide strong quantitative evidence that the shuttle should not have launched because of the significantly high probability of O-ring failure, a critical component of the spacecraft.
NASA has now made statistical and risk analysis of each shuttle component a priority prior to launch. This standard is likely to prevent many future disasters and promote the expansion of the United States’ space exploration program.
May we commemorate the late crew of the Challenger: Christa McAuliffe, Gregory Jarvis, Judith Resnik, Dick Scobee, Ronald McNair, Mike Smith, and Ellison Onizuka.

Written by Samson Qian
Edited by Jack Argiro & Alexander Fleiss
Sources:
[1] Tate, Karl. “The Space Shuttle Challenger Disaster: What Happened? (Infographic).” Space.com, Space, 28 Jan. 2016, www.space.com/31732-space-shuttle-challenger-disaster-explained-infographic.html.
[2] Homa, Ken. “The Challenger Disaster: A Tragic Lesson in Data Analysis ...” The Homa Files, The Homa Files, 2 June 2016, homafiles.info/2016/06/06/the-challenger-disaster-a-tragic-lesson-in-data-analysis/amp/.
[5] Silverman, Stan. “Leadership Lessons from the Challenger Disaster: Face the Brutal Facts of Reality.” Bizjournals.com, 27 Jan. 2020, www.bizjournals.com/philadelphia/news/2020/01/27/leadership-lessons-from-the-challenger-disaster.html.