Understanding The Stock Market & The Implications Of Negative Public Company Disclosures

Market reaction and warning mechanism of illegal information disclosure of public companies
Information disclosure plays a crucial role in regulating the behavior of public companies and protecting the minority shareholders' interests. An accurate, integrated, timely, and adequate disclosure is a legal obligation for listed companies based on the Securities Law of China. However, many listed companies in China intentionally violate the securities laws by providing untrue
information, delaying the announcement time, etc. out of their purposes. These can infringe the interest of the minority shareholders but also threaten the health and stability of the Chinese stock market.
This paper uses companies that violated the information disclosure law as a sample to study the impact of illegal disclosure. It conducts an event study to show the response of the market that follows the punishment announcement. Then, it forms an explanation of the market response. Finally, it develops a general model to predict potential illegal disclosure based on fundamental and corporate governance information. We hope to help investors better understand the mechanism of illegal disclosure and provide a possible way of prediction.
Research overview of motivation of illegal disclosure
Based on a sample of a public company penalized by the SEC for inaccurate accounting statements, Dechow, Sloan, and Sweeney (1996) believed that the primary motive for the management of listed companies to manipulate the surplus is to reduce the company's external financing costs and to avoid constraint of liability clause, rather than manipulate the stock price for profit. Based on the same American stock data sample, Beneish (1999) put forward a different view than the management to acquire performance-based option dividends, as well as make money through insider trading.
For the situation in China, the main views include:
a) The tunneling of listed companies is the root cause of information disclosure violation of listed companies.
Tang Zongming and Jiang Wei (2002), Li Zengquan, Wang Zhiwei and Sun Zheng (2004) respectively found empirical evidence of tunneling by controlling shareholders of listed companies in China from the perspective of bulk equity transfer and capital occupation of listed companies.
Liu Feng, He Jian-gang and Wei Ming Hai (2004), Zhang Guangrong and Zeng Yong (2006) conducted research on Wuliangye and Topsoftware and found evidence of tunneling. Liu Feng and He Jiangang (2004) analyzed the tunneling behavior of shareholders in a specific case on the basis of sampling, the realization of controlling shareholder hollowing out company is investigated, and they found the higher the controlling shareholding ratio is, the more the controlling shareholders are inclined to purchase and sell related transactions through large amounts of cash to hollow out the company.
For listed companies with dispersed equity and lower shareholding ratio of controlling shareholders, controlling shareholders are more likely to empty the company by means of equity transfer, guarantee or appropriation. For companies with medium equity concentration, the controlling shareholders tend to adopt guarantee, non-purchase and sale related transactions or move funds to hollow out the company. Tang Yuejun, Li Weian and Xie Jinming (2006) pointed out that under the circumstances of imperfect external audit constraints, controlling shareholders with absolute information advantage not only have the motivation but also the ability to whitewash or even falsify financial statements to cover up the actual problems and avoid the external audit constraints.
b) Insider manipulation of stock prices and other insider dealings is conducted through illegal disclosure.
Insider trading remains popular, driven by high profits. Dechow, Sloan and Sweeney (1996) and Beneish (1999) confirmed the existence of insider trading in the listed companies punished by the SEC because the management overestimated profits. Beneish (2002), Philippon (2004) and Cheng (2005) found that the management conducted insider trading and thus manipulated the profit. Wu Xingshuo (2019) and Wang Boyang (2020) provide another possibility that stock pledges of controlling shareholders can induce tunneling behavior.
c) The IPO policy, rights offering policy, special treatment and delisting policy force the listed companies to carry out earnings management, thus they are trapped in information disclosure violations.
The continuous profit is the core requirement for rights offering or additional offering of listed companies. In order to get over the threshold of rights offering or additional issuance, listed companies often use related party transactions and deliberately conceal relevant major matters to fit the requirements. The empirical study of Chen Xiaoyue, Xiao Xing and Guo Xiaoyan (2000) shows that listed companies have profit manipulation to meet the regulation of regulatory authorities on rights offering. Lei Guangyong and Liu Huilong (2006) further analyzed how the rights offering policy led to the earnings manipulation of listed companies. Due to delisting policy, some listed companies that have been losing money for one or two year will take risks and turn losses into profits by means of related party transactions or even financial fraud to avoid being singled out or delisted.

Research overview of market reaction of illegal disclosure
Taking 76 companies identified by the government as financial fraud-related stakeholders or in violation of regulatory rules as the study sample, Marciukaityte etc. (2006) found that their cumulative supernormal returns within the time interval of [-1,0] are significantly negative. Cai Zhiyue (2007) studied 152 non-financial A-share listed companies that were publicly condemned, criticized or punished by the China Securities Regulatory Commission and the Shanghai and Shenzhen stock exchanges for information disclosure violations between 2002 and 2005. Taking the information disclosure violation announcement date from [-20,+20] as the event window, he pointed out the information disclosure violation has indeed brought huge economic losses to investors. Meanwhile, investors react violently to the tunneling behavior, securities manipulation behavior and financial fraud behavior of major shareholders of a market company. There are some new approaches to analyze illegal disclosure. Zhang Chenyu (2019) drew a relationship between the morality of senior executives and illegal disclosure. Zhu Jie (2020) pointed that there is a U-shaped correlation between the remuneration incentive of independent directors and the information disclosure violations of listed companies, which indicates that the remuneration incentive level of independent directors is too high or too low to help restrain the information disclosure violations of companies.
Market reaction to illegal information disclosure
In general, the above research on the market reaction to the announcement of disclosure violation shows that illegal disclosure has a negative impact on corporate value. Within a short period (usually the announcement day or a week after) of the announcement of illegal disclosure, investors vote with their feet and the company's share price falls significantly.
Market reaction to illegal information disclosure
Previous studies has shown the negative influence of illegal information disclosure on corporate value. With stricter supervision and the introduction of supplementary regulations in the past 3 years, the illegal information disclosure activities are different from the past, so that it is valuable to scan whether there are current changes of market reaction. Hence, this paper takes 440 A-share listed companies that were publicly condemned, criticized or punished by China Securities Regulatory Commission and the Shanghai and Shenzhen Stock exchanges for illegal information disclosure from 2017 to 2019 as the research objectives. The market transaction data and announcement data used in this paper are derived from the CSMAR database.
Time window selection
In 1983, Strachan etc. studied the market reaction to 84 corporate irregularities in American public companies in the 1970s. Using the mean-adjusted earnings model (mean-adjusted earnings model), they investigated the impact of the company's announcement on stock market price in the incident time interval of [-25, +10]. Davidson (1988) also took the day when the Wall Street journal published the company's violation as the event date, respectively using the market model and the average return model, and investigated the time interval of the event as [-90, 90]. Scholz (2004), Chad (2005) and other scholars also took the day of the announcement of corporate violations as the event day. Song Chuan (2012) and Cai Zhiyue(2007) found that the event window of [-20, +20] best reveals the influenced time interval.
Referring to the practice of the above scholars, this paper adopts the event study method to test every announcement of company violation. The abnormal returns of each day of the event window and its significant level. The announcement date here is referred to by the China Securities Regulatory Commission and Shanghai Stock Exchange, the day (t=0) on which the company is publicly criticized, condemned or punished. And the event window period is of t=-20 to t=+20.
Calculation of the abnormal return
This paper uses the market model (MM) to calculate abnormal return.
Meanwhile, we can calculate the average abnormal return (AAR) at time t and the cumulative abnormal return (CAR) within the time period.
Empirical results and analysis
Full sample result
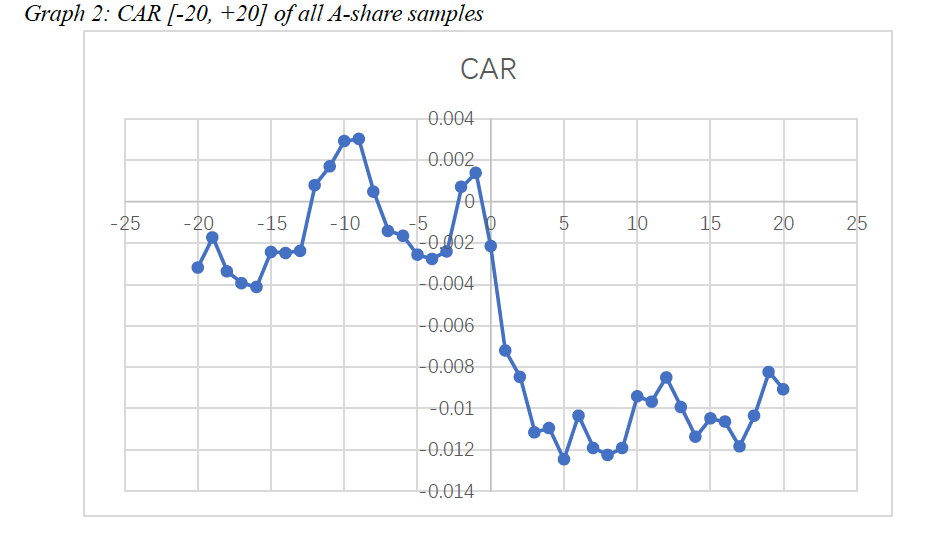
We find that AAR and CAR of the event time window of [-20, +20], and we implicate t-test to figure if AAR is significantly different from 0 under 10%, 5% and 1% significant level. Before announcement day, AAR of t = -20, -12, -8 and -2 is significantly different from 0. At t = 1, the AAR is away from 0 under 1% significant level while reaching the lowest: -0.5%.
The reason that the lowest point is on t = 1 rather than t = 0 is that the announcement usually comes out after market closing, thus investors react to it on day t = 1.
After announcement day, AAR of t = 1, 3 and 10 is significantly different from 0. The above results indicate the following phenomenon:
1) Violation of rules has a negative impact on the stock price in the short run, while a positive impact in the long run in some cases.
2) There is information leak or other indication causing the stock price to react to the event before the announcement of violation.
3) The announcement is manipulated to receive a relatively high abnormal return. Graph 1 and graph 2 visually show the AAR and CAR result that support the 3 arguments above.
In addition, for the phenomenon that investors react before the disclosure of illegal information, this paper speculated that the announcement of the penalty must be based on an in-depth investigation into the company by the regulator. As investigation has to go through over a long period of time, the market will capture the information about the companies being investigated in advance.
We notice that the CAR reached a stable platform around the t=10 period of time. However, there is a possibility that the AR may compensate for the fall during t=0 to t=10. To justify this argument, we adjust the event window from [-20, +20] to [-20, +50].
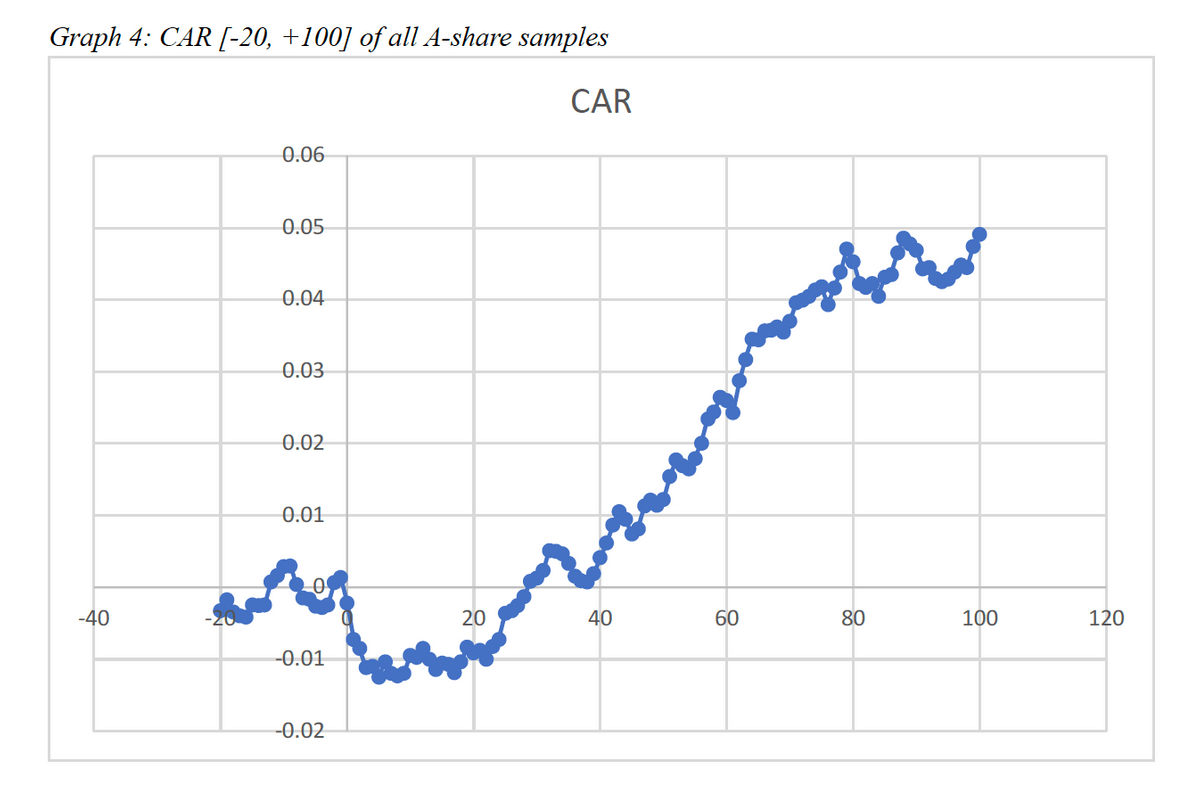
As shown in graph 3, after a sudden fall of CAR after t = 0, the CAR begins to go up within the t = 20 to 50 period. This result is counterintuitive because it seems that the announcement of illegal disclosure is bad news for the company, just as the market reacts in t = 0 to 10. While the trend CAR reverses at t = 20 and goes beyond 0 at t = 28. As there is still an upward trend at t = 50, it is proper to prolong the event window to see when CAR reaches its second platform. In graph 4, CAR reaches its platform at t = 80. This draws a possibly full picture of the market reaction:
(1) Before the announcement, the market or insider may receive information, causing AAR significantly different from 0. We define this period as the Down Period.
(2) The announcement was made at t = 0, and markets reacted quickly, causing a -0.01 CAR from t = 0 to t = 10. We define this period as the Platform-1 Period.
(3) The reaction comes to an end with a platform stage of t = 10 to t = 20, however, the CAR continuously grows between t = 20 to t = 80, from CAR = -0.1 to CAR = 0.45. We define this period as the Up Period.
(4) The second platform formed after t = 80. We define this period as the Platform-2 Period.
This indicates potential stock price manipulation, as the CAR acts strangely within t = 20 to t = 80. However, further study is needed to take a deeper look into this.
Result classified by types of punishment
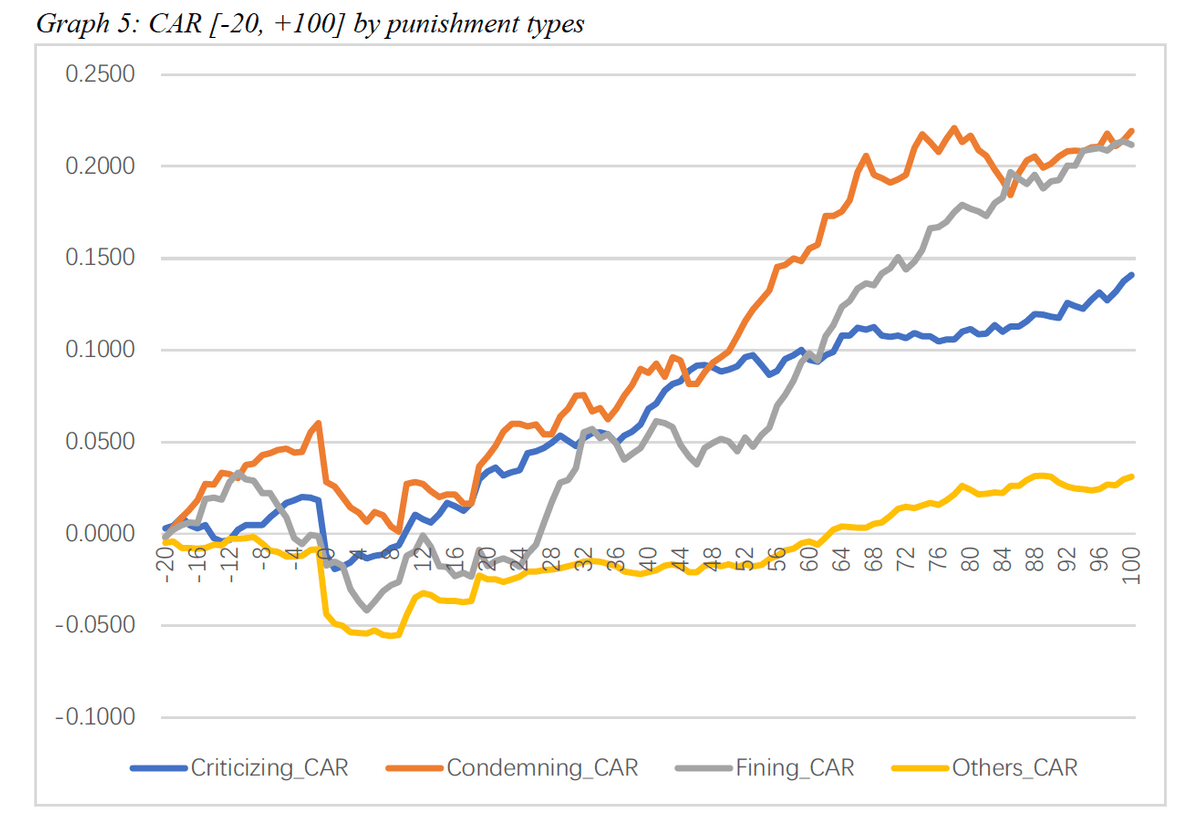
The punishment of illegal disclosure includes criticizing, warning, condemning, fining and others. The punishment is announced together with the violation announcement, which can provide further evidence for investors of the degree of the violation. Thus, this paper takes a look into the AAR and CAR of different types of punishment.
We find that warning and fining are always implicated simultaneously, thus, we classify the sample by 4 types of punishment: criticizing, condemning, fining and others.

We notice that the other type of punishment samples receive the maximum fall in Down Periods and minimum rise in Up Periods. Other punishment includes administrative punishment, etc. A Fine receives the second biggest fall in Down Periods and almost the maximum rise in Up Periods. This means that fining has a relatively heavy influence in the short run, while accelerating the CAR to go up in the Up Period.
Even more, the condemning sample shows a continuously positive CAR, indicating there are almost no negative effects of the punishment.
All of the AARs pass the t-test under 95% significance level. However, this result points out different characteristics of market reaction of different punishment types.
Result classified by types of disclosure violation
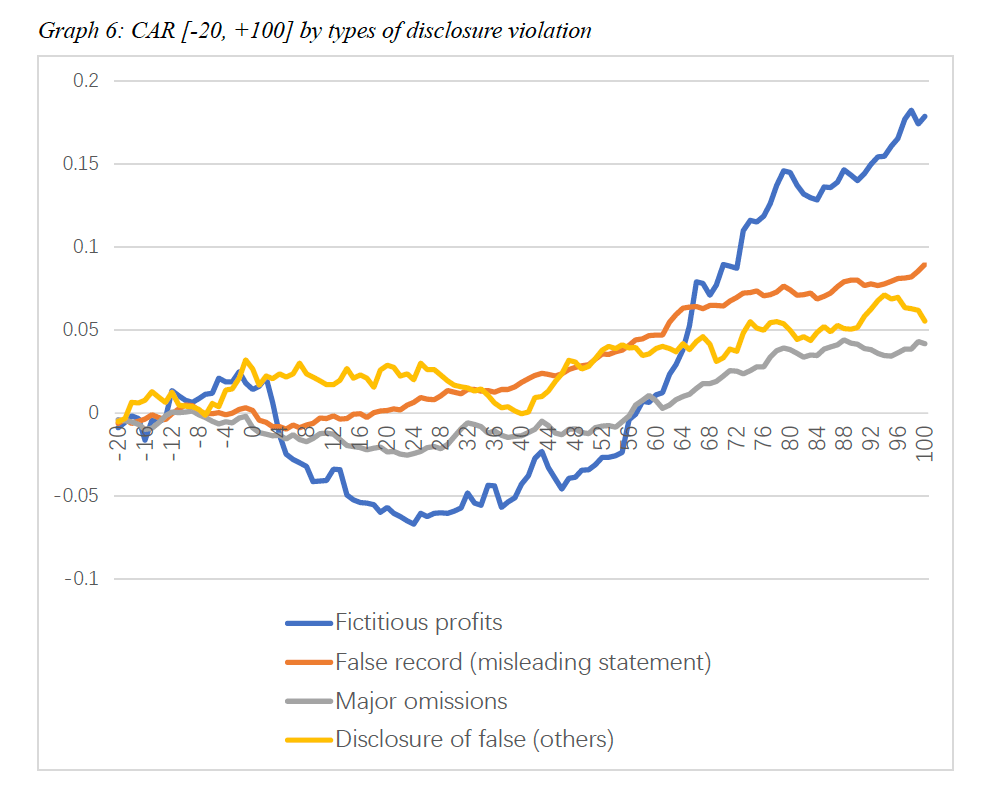
Main disclosure violation types include: Fictitious profits; False-listed assets; False record (misleading statement); Major omissions; Disclosure of false (others). Each type stands for different kinds and thus different severity of illegal disclosure. To analyze types of disclosure violation, we group samples by the main violation types.
We exclude false-listed assets because it only has 1 sample. It is surprising that disclosure of false (others) type shows a positive CAR within the whole event window, indicating that the listed 3 violation type is the major disclosure type, and others do not show a negative sign.
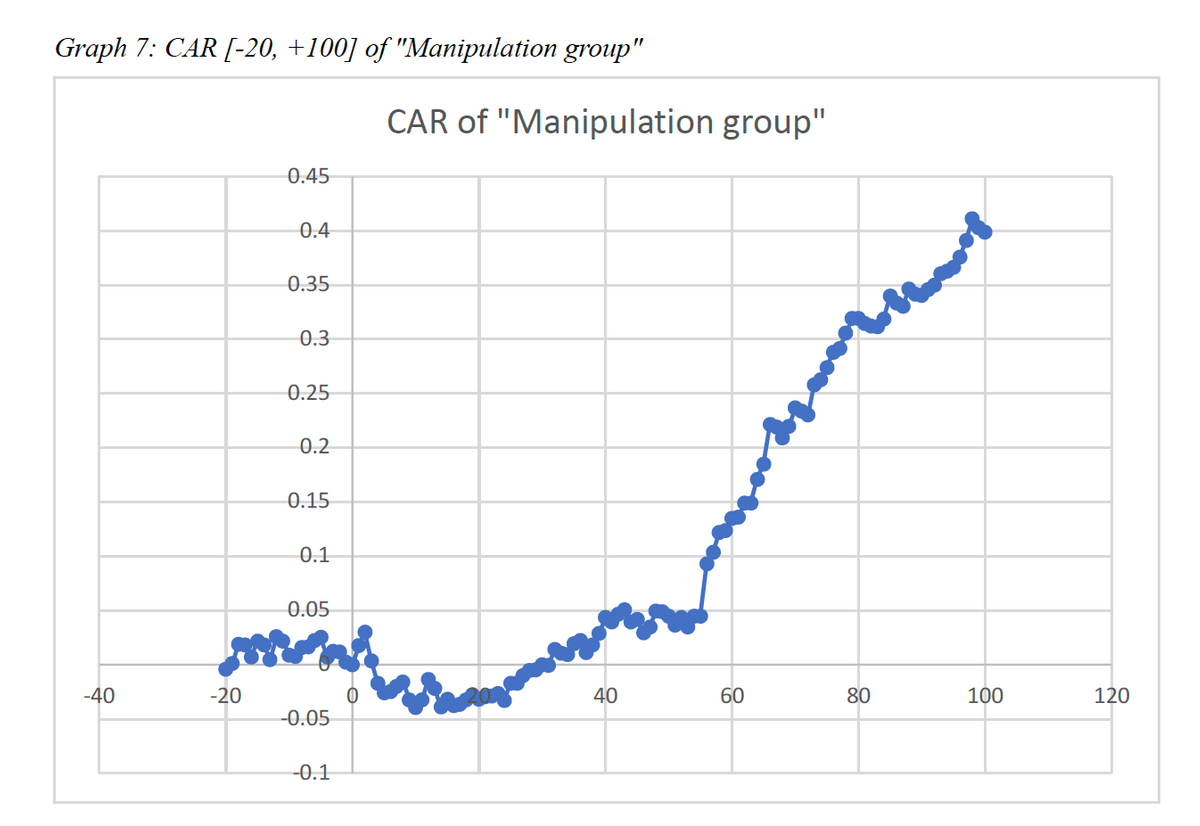
Fictitious profits groups receive the maximum fall in Down Period and maximum rise in Up Period, giving the highest volatility. This could be a result of stock price manipulating using fake profit announcements. To further illustrate this opinion, we construct "Manipulation group", to include fictitious profit violation stocks that end up with fining punishment. To receive an incredibly high CAR after t = 30. Within the 100 days after the announcement of violation, we can earn almost 40% CAR! This result strongly supports the opinion that major stock holders tend to intentionally violate the disclosure rule to receive a relatively high abnormal return.
The market reaction to illegal disclosure announcement can be described as Down Period (from t = 0 to t = 10), Platform-1 Period (from t = 10 to t = 20), Up Period (from t = 20 to t = 80) and Platform 2 Period (after t = 80).
Evidence also shows that incredibly high CAR is received through disclosure violation. This can be a huge threat to the healthy market order and the development of the stock market.
Warning mechanism of illegal information disclosure
In view of the serious harm of information disclosure violation of listed companies, finding and preventing information disclosure violation has become an urgent matter for investors and regulators. Based on the previous research on information disclosure fraud, financial, marketing and management perspective, we use factor analysis and stepwise logistic regression analysis to improve extract the most effective warning variables, thus discrimination and projections for violations of listed companies. Also, linear model and nonlinear model is applied to analyze the effect of information disclosure violations, early warning, so as to provide decision-making basis for investors and regulators.

Variable selection
Violation indicators
We use the 2 indicators below to describe violation event:
1) Whether there is violation: violation = 1, no violation = 0
2) The severity of punishment: no punishment = 0, exchange punishment = 1, China Securities Regulatory Commission (CSRC) punishment = 2
Financial indicators
As the most intuitive and public manifestation of the operating performance of listed companies, financial indicators have always been the preferred variable for researchers to conduct fraud early warning. Considering the situation in China, we choose the following 13 financial indicators as alternative replacement variables, which cover the company's profitability, operating ability, solvency, development ability and cash flow and other five aspects of information.
Market indicators
Financial indicators are the reflection of the company's past operating performance, but they are insufficient to explain the company's internal growth opportunities and market views of them. Thus, we introduce the average daily return of T-1 year as a proxy variable for volatility. Meanwhile, we use turnover rate as an indicator of speculation of the stock. The worse the information disclosure is, the more active the insider trading is, causing a relatively high turnover rate (Llorente, 2002). We also use the daily volume, P/E ratio and P/B ratio of T-1 year as market indicators, as shown below.
Our Alternative market indicators
Symbol
Name
X14
Daily average turnover rate
X15
Daily average revenue
X16
Daily average volume
X17
P/E ratio
X18
P/B ratio
Corporate governance indicators
Modern corporate governance theory holds that a good corporate governance mechanism depends on the organic combination of internal and external mechanisms. Internal mechanisms include ownership concentration, board governance and executive incentives, while external mechanisms include market for corporate control, legal protection for small and medium-sized investors, product competition market, independent audit and institutional investor supervision. Based on the previous
theoretical and empirical research on corporate governance, combined with China's specific governance practice, this paper constructs corporate governance warning indicators from the following dimensions.
Selection of the most effective variables
Using stepwise-logistic regression analysis, we first analyze the 13 financial indicators, and choose the 4 most effective indicators. The same regression is done to market indicators.
The reason we conduct special treatment for corporate governance indicators is that they may not be single or simply combined to play a governance role, but more likely to cross together to achieve the governance effect. Therefore, we use the factor analysis method to find the linear combination of governance indicators to maximize the description of its changes, and conduct stepwise-logistic regression to the combined factors.
To sum up, we extract and select alternative financial indicators, market indicators and governance indicators by using stepwise-logistic regression analysis and factor analysis, and takes the four indicators, including earnings per share, net asset interest rate, current ratio and asset-liability ratio, which are most closely related to the violation behavior, as the financial warning variables of the model. The average daily revenue is taken as the market warning variable. Four governance factor variables, including 1) board independence and executive incentive, 2) ownership concentration degree and ownership balance degree of ownership structure), 3)supervision degree of audit, and 4) supervision degree of institutional investors are taken as corporate governance warning variables of our model.

Design of our model
Fisher linear discriminant analysis (LDA)
LDA conducts dimensionality reduction carried out by projection, and all labeled training data points are projected onto a straight line (or low-dimensional hyperplane), so that the positions of the two data points after projection can be met, with the smallest in-class deviation and the largest inter-class deviation, that is, the projection points of the same kind of samples are as close as possible, and the projection points of different kinds of samples are as far away as possible.
The steps of the estimation method of Fisher linear discriminant model are as follows :(l) Select experimental samples and test samples from two different populations respectively; (2) Determine a set of discriminant variables that can effectively distinguish various characteristics of these different populations; (3) Record the discriminant variable values of each sample unit in the years prior to the occurrence of the event; (4) Fit and discriminate model; (5) Test the estimated parameters of the discriminant model; (6) Test the experimental samples to determine the accuracy of the estimation model; (7) Discriminate the test samples to confirm the accuracy of the estimation model.
Logistic regression model
The Logistic regression model uses the maximum likelihood method to estimate each parameter value according to the sample data, and then calculates the probability of company violation through the above formula. The curve of the Logistic regression model is of S-type, and the predicted maximum value tends to 1, and the predicted minimum value tends to 0, so it is often used for nonlinear 0-1 classification prediction. In this paper, 0.5 is selected as the segmentation point of the Logistic regression model. In other words, if the probability month calculated by the model is greater than or equal to 0.5, the company will be judged as a violation company. If less than 0.5, it is judged as a non-offending company, that is, a normal company.
Empirical result of warning models
We use 80% of the total data to construct the LDA model.
And we use the rest of our data to test the effectiveness of our model: There is 70.0% probability that we figure out the violation company; 86.7% probability that we figure out the normal company. The total accuracy is 78.33%.
Using the same divide of training data and testing data, here is our result of the logistic regression model: There is 80.0% probability that we figure out the violation company; 83.3% probability that we figure out the normal company. The total accuracy is 81.7%.
In this chapter, we construct 2 warning models using the variables that we selected in the last chapter. Both the LDA model and logistic regression model provide a strong warning ability, with around 80% accuracy to judge the company.
Therefore, we suggest that regulators could try to establish a risk warning mechanism for information disclosure violations of listed companies. Based on the financial data of listed companies, market transaction data and corporate governance data, it is able to gradually establish a dynamic regulation using LDAand Logistic regression model to risk potential disclosure violation to better protect the rights and interests of investors.
Conclusion and policy suggestion
Our research on the market reaction to the announcement of disclosure violation shows that illegal disclosure has a negative impact on corporate value. Within a short period (usually the announcement day or a week after) of the announcement of illegal disclosure, investors vote with their feet and the company's share price falls significantly. However, there is also an incredible rise of CAR after the downward reaction. To be more specific, the market reaction to illegal disclosure announcement can be described as Down Period (from t = 0 to t = 10), Platform-1 Period (from t = 10 to t = 20), Up Period (from t = 20 to t = 80) and Platform-2 Period (after t = 80).
As we group the violation sample with punishment type and violation type, we notice that others type of punishment samples receive the maximum fall in Down Period and minimum rise in Up Period. Other punishment includes administrative punishment, etc. Fining samples receive the second biggest fall in the Down Period and almost the maximum rise in the Up Period. This means that fining has a relatively heavy influence in the short run, while accelerating the CAR to go up in the Up Period.
Meanwhile, fictitious profits groups receive the maximum fall in Down Period and maximum rise in Up Period, giving the highest volatility. This could be a result of stock price manipulating using fake profit announcements. To further illustrate this opinion, we construct "Manipulation group", to include fictitious profit violation stocks that end up with fining punishment. We receive an incredibly high CAR after t = 30. Within the 100 days after the announcement of violation, this portfolio receives almost 40% CAR. This strongly supports the opinion that major stock holders tend to intentionally violate the disclosure rule to receive a relatively high abnormal return.

This can be a huge threat to the healthy market order and the development of the stock market. To better monitor this violation, we build LDA and logistic regression models to act as a warning of illegal information disclosure. Both the LDA model and logistic regression model provide a strong warning ability, with around 80% accuracy to judge the company.
We suggest that regulators could try to establish a risk warning mechanism for information disclosure violation of listed companies. Based on the financial data of listed companies, market transaction data and corporate governance data, it is able to gradually establish a dynamic regulation using LDA and Logistic regression model to risk potential disclosure violation to better protect the rights and interests of investors. Based on the stepwise logistic regression analysis, we conclude 6 main points for regulators to focus on:
1) Reduce supervision cost and improve inspection quality.
2) Increase the punishment for violation of the law thus increasing the cost of violation. 3) Give full play to external oversight mechanisms such as external audit.
4) Improve the corporate governance structure.
5) Improve the independence of the board.
6) Establish an audit Committee.
The samples of this study are time-limited. Also, in the practical application of violation warning, the cost of misjudging the offending company as a non-offending company (type I error) is far greater than that of misjudging the offending company as a non-offending company (type N error), both from the perspective of regulators and from the interests of investors. Therefore, the actual early warning model should consider the misjudgment cost as well as the prior probability.
In conclusion, further research is needed of course, but we hope this paper can give the regulator an insight into improving the regulation.
Written by Yincong He

References
[1] Agrawal, A. , Chadha, S. Corporate Governance and Accounting Scandals [J]. Hournal of Law and Economics, 2005, 48(2): 371-406.
[2] Ajinkya, B., Bhojraj, S., & Sengupta, P. (2005). The association between outside directors, institutional investors and the properties of management earnings forecasts. Journal of accounting research, 43(3), 343-376.
[3] Albrecht, W. S., Wemz, G. W., Williams, T. L. Fraud: Bring the Light to the Dark Side of Business. New York Irwin Inc., 1995.
[4] Bae, K. , Kang, J. , Kim, J. Tunneling or Value Added? Evidence from Mergers by Korean Business Groups [J]. Journal 02,57(6): 2695-2740.
[5] Bell, T. B., Carcello, J. V. A Decision Aid for Assessing the Likelihood of Fraudulent Financial Reporting [J], Auditing, 2000,19(1): 169484.
[6] Bergstresser, D. B. , Philippon, T. CEO Incentives and Earnings Management [J]. Journal of Financial Economics, 2006,80(3):511-529.
[7] Chen, Gong-meng, Michael Firth, Ning Gao and Oliver Rui. 2005. Do Ownership Structure and Governance Mechanisms have an Effect on Corporate Fraud in China's Listed Firms? SSRN working paper.
[8] Cheng, Qiang, Warfield, T. D. Equity Incentives and Earnings Management [J], The Accounting Review, 2005,80(2): 44M76.
[9] Fanning, K. , Cogger, K. Neural Network Detection of Management Fraud using Published Financial Data [J] . International Journal of Intelligent Systems in Accounting, Finance & Management, 1998,7(1): 21-41.
[10] Farber, D. Restoring Trust after Fraud: Does Corporate Governance Matter? [J]. The Accounting Review, 2005,80(2): 539-561.
[11] Gerety, M. , Lehn, K. The Cause and Consequences of Accounting Fraud [J]. Managerial and Decision Economics, 1997,18(7/8):587-599.
[12] Green, B. P. , Choi, J. H. Assessing the Risk of Management Fraud through Neural Network Technology [J]. Auditing, 1997,16(1): 14-28,
[13] Hart, O. The Market Mechanism as an Incentive Scheme [J]. Bell Journal of Economics, 1983, 14(2): 366-382.
[14] Jensen, M. C. The Modem Industrial Revolution, Exit, and the Failure of Internal Control System [J]. Journal of Finance, 1993,48(3):831-880.
[15] Lin, J. W. , Hwang, M. I. , Becker, J. D. A Fuzzy Neural Network for Assessing the Risk of Fraudulent Financial Reporting [J]. Managerial Auditing Journal, 2003,18(8): 657-665. [16] Merton, R.C. A Simple Model of Capital Market Equilibrium with Incomplete Information [J]. Journal of Finance, 1987,42(3):483-510.
[17] Ross, S. A., Westerfield, R. W., Jaffe, J. E Corporate Finance [M]. 2nd ed. Homewood, IL. 2005.
[18] Siegel, J. G How to Analyze Businesses, Financial Statements, and the Quality of Earnings [ M ]. 2nd ed. Englewood Cliffs, NJ: Prentice-Hall, 1991.
[19] Yermack, D. Higher Market Valuation of Companies with a Small Board of Directors [J]. Journal of Financial Economics, 1996,40(2):185-211.
[20] Cai Zhiyue. Research on the Motivation, Market reaction and Early warning of Information
disclosure Violation by Chinese listed companies [D]. Xiamen university, 2007. [21] Chen Guojin, Lin Hui, Wang Lei. Analysis of corporate governance, reputation mechanism and Illegal Behaviors of listed companies [J]. Nankai Management Review, 2005, (6): 35-40. [22] Chen Xiaoyue, Xiao Xing, Guo Xiaoyan. Allotment and Profit Manipulation of Listed Companies [J]. 2000, (1): 30~36.
[23] Liu Feng, He Jiangang, Wei Minghai. Control, Performance and Profit Delivery -- A Case Study based on Wuliangye [J]. 2004,(8): 102-110.
[24] Song Chuan. Research on market Reaction and Early Warning of Information Disclosure Violation of Listed Companies in China [D]. Southwestern University of Finance and Economics, 2012.
[25] Tang Zongming, JIANG Wei. Empirical Analysis on the Degree of Shareholder infringement in Chinese listed companies [J]. Economic Research, 2002, (4): 44-50.
[26] Wu Lina, Gao Qiang. Research on market reaction of penalty announcement [J]. Economic Science, 2002, (3): 62-73.
Information disclosure plays a crucial role in regulating the behavior of public companies and protecting the minority shareholders' interests. An accurate, integrated, timely, and adequate disclosure is a legal obligation for listed companies based on the Securities Law of China. However, many listed companies in China intentionally violate the securities laws by providing untrue
information, delaying the announcement time, etc. out of their purposes. These can infringe the interest of the minority shareholders but also threaten the health and stability of the Chinese stock market.
This paper uses companies that violated the information disclosure law as a sample to study the impact of illegal disclosure. It conducts an event study to show the response of the market that follows the punishment announcement. Then, it forms an explanation of the market response. Finally, it develops a general model to predict potential illegal disclosure based on fundamental and corporate governance information. We hope to help investors better understand the mechanism of illegal disclosure and provide a possible way of prediction.